01
Stuntmer
02
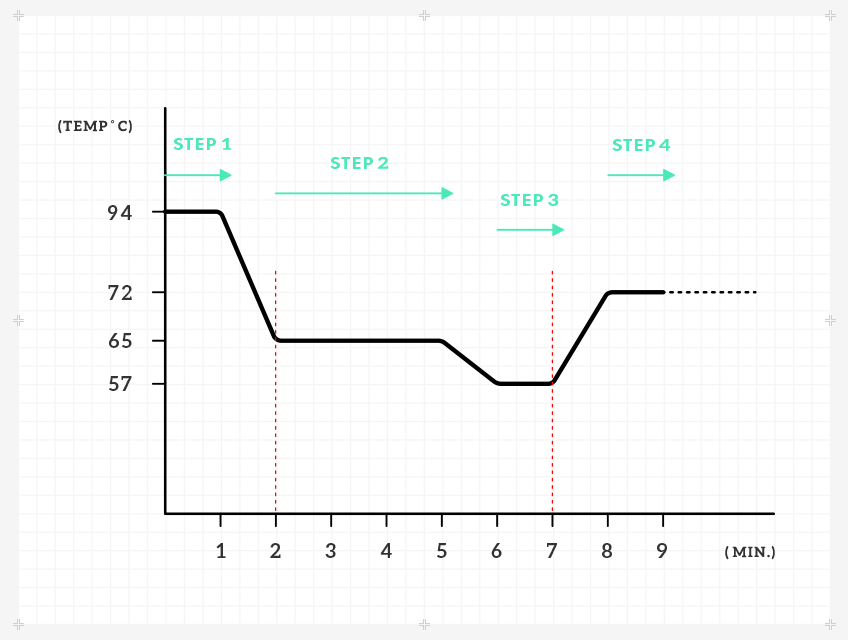
PCR Condition
03
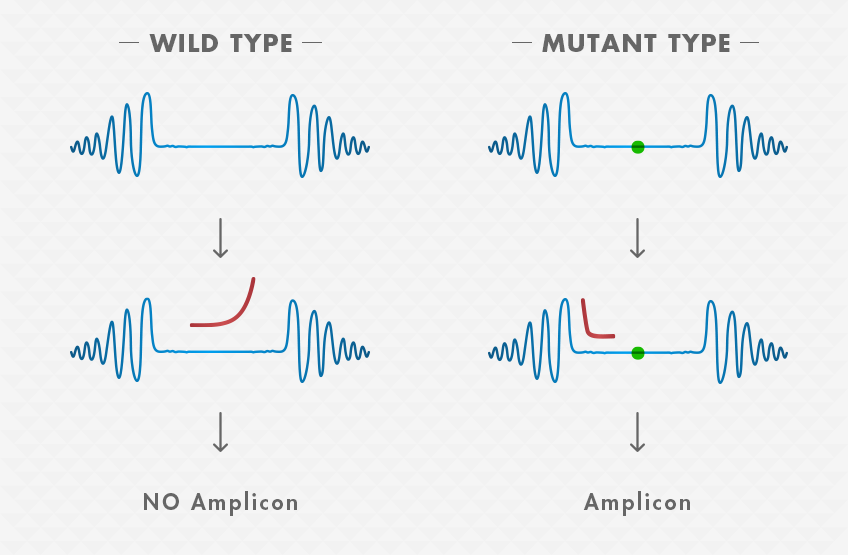
Mutation amplicon yield
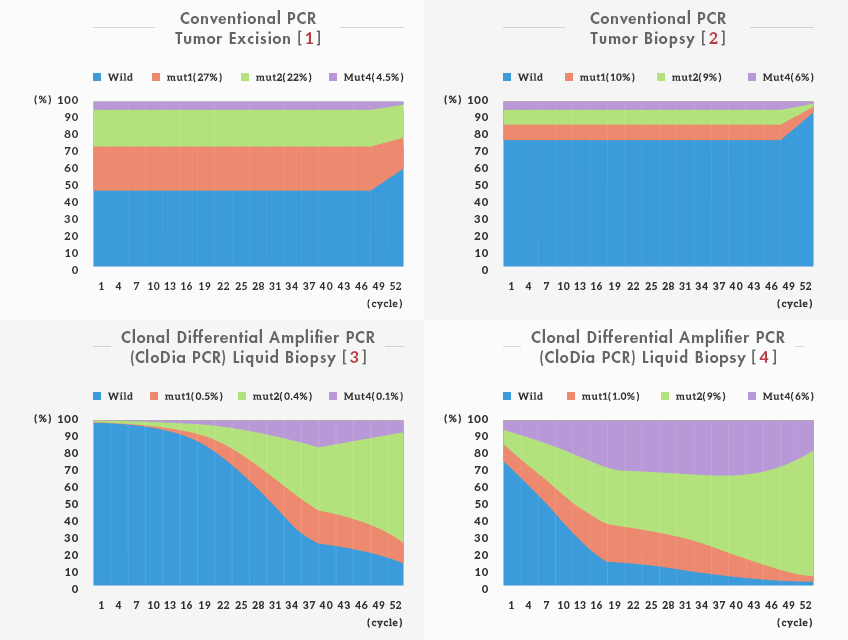
In these four pictures, the x-axis is corresponding to PCR cycle numbers, the y-axis is corresponding to the DNA variants percentage in one PCR reaction tube. The blue color is wild type. The other colors are heterogeneous mutations.
Please see the upper two pictures, they are tumor samples amplified by conventional PCR. The wild type DNA template is 45% and 75%. During the PCR cycles, the limitation of raw materials lead to population unbalance after 45 PCR cycles. At picture number 1, the mutant type signals are still visible by Sanger’s DNA sequencing, but at picture number 2, the mutant signals are similar to the background noise.
The lower two pictures are tumor samples amplified by CloDiA PCR. The wild type DNA template is 75% and 99%. During PCR cycles, the amplification efficiency of wild type is significantly less than all kinds of mutants. This mechanism we call it clonal differential amplifier, and that’s the name CloDiA comes from.
04
Mutation dominant recommended cycles

-

CERTIFICATION of ITC
-
CERTIFICATION of UDEM